Analysis Database
-
Using Analysis Database
-
Filter
-
Using Filter dialog box
-
Working with Filter
Starting Analysis Database
Starting Analysis Database can be started via
- Start button on the Windows Task Bar:
- Go to the Programs/Correlator Data Processor/ and click the Analysis Database item;
- Choose Run and specify the path to AnalysisDB.EXE;
- Windows Explorer:
- Locate and double-click the AnalysisDB.EXE file (if you have performed a default installation, this file is located in \Program Files\SSTC\FFS Data Processor\Bin).
About Analysis Database
Analysis Database is used for economical storing and easy managing of results of analysis, which has been performed in FFS Data Processor. It provides convenient and fast way of searching and retrieving information. This software let one to get rid of a great amount of paper needed to keep information about the measurements, performed analysis as well as to avoid routine manipulation with computer files, folders, etc.
Database consists of several tables with the automatically supported relationships between them.
The main features of the database are:
-
fast storing of analysis results, often-used model and parameter linkage configurations (Templates) in the Database;
-
convenient representation of analysis results;
-
representation of templates configuration;
-
extensive possibilities for searching and filtering information;
-
build-in two-dimensional graphical pre-viewer of experimental and recovered characteristics and residuals;
-
two-dimensional graphical pre-viewer of estimated parameters dependence
-
export data to the ASCII files;
-
quick deleting all records from the tables;
-
packing tables (reduces size of the tables);
-
checking and repairing the tables;
-
generating and printing user-defined reports on the base of the selected records.
Database supports data integrity and validity. All information concerning the defined object is stored in one record in table. The mechanism of data integrity forbids deleting a record from one table which is linked to the records in the other tables. Data validity guarantees that values stored in the tables are always valid by the checking of the range and type of the entered data. Database is protected from the accidental changing or deleting of information by the default forbidding of editing.
Database avoids data redundancy: each record has only one instance. It means that it is not required to enter information into the tables, if the same information is already stored in the database. User can just establish the relation between the entered and stored information. This feature is especially useful when one needs to update records in the database. The correction should be done only once at one point (where the changed information is stored) and then this update will take effect in all records which are related to the selected one.
Database provides extensive possibilities for searching information. The fastest way how to find a record by a specific field is by typing first symbols of this field in a special window. Cursor moves to the record with the field, which contains symbols matching the typed ones. The possibility to sort any table by any field is also supported.
User may also interactively create filter with complex conditions in order to decrease the selected number of records.
Such operations as looking through the records, deleting records, editing information are provided by Database Navigator.
Menu
Main menu consists of the following several popup items:
|
Items
|
Description
|
|
File
|
Contains menu commands for
importing/exporting data.
|
|
Find
|
Contains menu commands for finding
information.
|
|
Sort
|
Contains menu commands for sorting
tables.
|
|
Preview
|
Contains menu commands for
previewing graphs of experimental and recovered characteristics and
residuals, estimated parameters dependence and DataSet
properties.
|
|
Reports
|
Contains menu commands for
setting the page setup and previewing and printing automatically
created reports.
|
|
Tools
|
Contains menu commands for communicating
with FFS Data Processor, previewing of the Templates and
performing some service database functions.
|
|
Help
|
Contains menu commands for accessing the
online Help and information about the copyright.
|
File menu
Use commands of the File menu for importing/exporting a data.
The File menu contains the following commands:
|
Commands
|
Description
|
|
Export
data
|
Opens
Export
data dialog box that
allows exporting the target criterion value, parameters groups, free
parameters and arrays of experimental and recovered characteristics
and residuals to the text file.
|
|
Exit
|
Finishes the work with Analysis Database.
|
Find menu
Use the commands of the Find menu for finding information.
The Find menu contains the following commands:
|
Commands
|
Description
|
|
Quick
Search
|
Displays a search box for the corresponding field. If you
want to find quickly the necessary record you should type the first
few characters and press Enter. In this case the application
will automatically select the first record that contains at the
beginning the characters, which matched the typed ones. For the
Numeric, Logical and Data/Time fields you should type the whole value
for the correspondent field. To close the search box, press
Esc.
|
|
Filter
|
Opens Filter.hlpFilter
dialog box
that
allows creating the filter that can be applied to the selected table
If this filter is applied, the only table records that correspond to
the filter criteria will be displayed.
|
|
Remove
All Filters
|
Removes the filter from all tables.
|
Sort menu
Use the commands of the Sort menu for sorting tables.
The Sort menu contains the following commands:
|
Commands
|
Description
|
|
Ascending
|
Sorts records of the table in ascending order by the selected
field.
|
|
Descending
|
Sorts records of the table in descending order by the selected
field.
|
Preview menu
Use the commands of the Preview menu for previewing graphs of experimental and recovered characteristics and residuals, estimated parameters dependence and DataSet properties.
The
Preview menu contains the following
commands:
Reports menu
Use the commands of the Reports menu for setting the page setup and previewing and printing automatically created reports.
The
Reports menu contains the following commands:
Tools menu
Contains menu commands for communicating with FFS Data Processor, previewing of the Templates and performing some service database functions.
The
Tools menu contains the following commands:
|
Commands
|
Description
|
|
Pack
Tables
|
Reduce size of tables by releasing any free
space.
|
|
Empty
Analysis Tables
|
Deletes all records from all tables, except
Templates and Custom Models tables.
|
|
Empty
Templates Table
|
Deletes all records from the Templates
table.
|
|
Empty
Custom ModelsTable
|
Deletes all records from the Custom Models table.
|
|
Check
and Repair Tables
|
Checks all tables and repairs them if they
are corrupted.
|
|
Send
to FFSDP
|
Sends current analysis to the FFS Data
Processor.
|
|
Templates
|
Opens
Templates
form.
|
Help menu
Use commands of the Help menu to access the help and get information about the copyright.
The
Help menu contains the following commands:
|
Commands
|
Description
|
|
Help
Contents
|
Opens Help topic contents.
|
|
About
|
Displays the copyright and version number for Analysis
Database.
|
Toolbar
The Toolbar is a row of buttons at the top of the Main window which represents application commands. Clicking one of the buttons is a quick alternative way to choose a command from the Menu. Buttons on the toolbar are activated or deactivated according to the state of the application.

To find out more about the functionality of any toolbar button, click this button on the figure above.
The Toolbar has short Help Hints. Help Hint is the pop-up text that appears when the mouse pointer passes over a toolbar button.
Button "View Table as Datasheet" 
This button views the table as datasheet.
Button "View Table as Form" 
This button views the table as form.
Button "Send analysis to FFSDP" 
This button sends current analysis to the FFS Data Processor.
Button "Ascending Sort" 
This button sorts records of the table in ascending order by the selected field.
Button "Descending Sort" 
This button sorts records of the table in descending order by the selected field.
Button "Quick Search" 
This button displays a search box for the corresponding field. If you want to find quickly the necessary record you should type the first few characters and press Enter. In this case the application will automatically select the first record that contains at the beginning the characters, which matched the typed ones. For the Numeric, Logical and Data/Time fields you should type the whole value for the correspondent field. To close the search box, press Esc.
Button "Filter" 
This button opens Filter.hlp>mainFilter dialog box that allows creating the filter that can be applied to the selected table If this filter is applied, the only table records that correspond to the filter criteria will be displayed.
Button "Preview" 
This button opens Preview Window for two-dimensional preview of the experimental and recovered characteristics and residuals.
Button "Help" 
This button opens Help topic contents.
Database Navigator
Such operations as moving from one record to another, deleting records and editing information are supported by the Database Navigator.


To find out more about the functionality of any Navigator button, click this button on the figure above.
Navigator button First
This button moves to the first record.
Navigator button Previous
This button moves to the previous record.
Navigator button Next
This button moves to the next record.
Navigator button Last
This button moves to the last record.
Navigator button Delete
This button deletes the current record.
Navigator button Edit
This button switches the state of the table in the edit mode. After updating information it is possible to save changes by pressing the Post button or cancel changes by pressing the Cancel button.
Navigator button Post
This button saves current record.
Navigator button Cancel
This button cancels changes.
Navigator button Refresh
This button refreshes the information in the table. Valuable in multiuser application when several users work with the Database simultaneously.
Main Window
Main Window consists of the following components:
- Menu
- Toolbar
- Analysis page
- Parameters page
- Status Bar
An example view of the Database Main Window is given in the following figure:
Menu and Toolbar provide quick way to invoke the commands of the application.
Analysis and Parameters pages display all information about one particular analysis.
Status bar, which is a horizontal area in Analysis Database below the pages, provides information about the current state of application and any other contextual information.
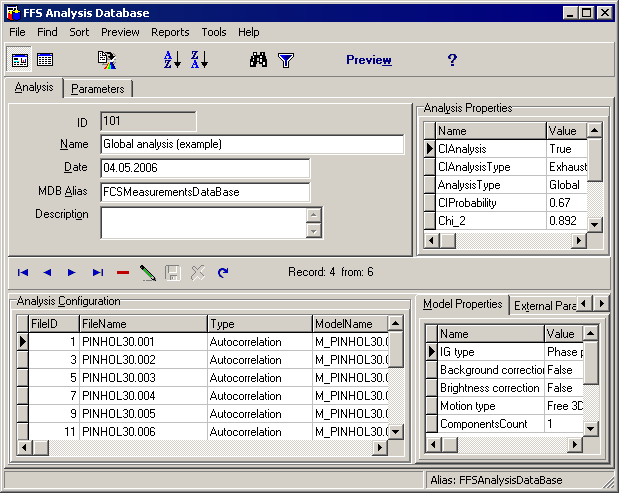
Analysis page
This page is used for viewing the configuration and properties of the analysis.
Analysis table is the main table in the Analysis Database (top left grid). If you select the record in this table you get all information about one particular analysis. Use the Database Navigator to manage the records of the Analysis table. The tables, which are depended on the Analysis table, contain properties and parameters of the analysis and configuration of the analysis. If you delete the record in the Analysis table, all records that are related to the analysis will be deleted.
Parameters, parameters groups and parameters linkage are displayed in Parameters page
An example view of the Analysis page is given below:
The following components are related to the Analysis page:
Analysis table
Analysis Properties table
Database Navigator
Analysis Configuration table
Model Properties table
External Parameters table
Click the corresponding item to get more information about it.
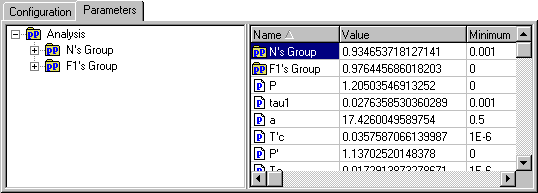
Parameters page
This page is used to view the settings of the estimated parameters, parameters groups and parameters linkage.
The properties and configuration of the analysis are displayed in Analysis page.
An example view of the Parameters page is given below:
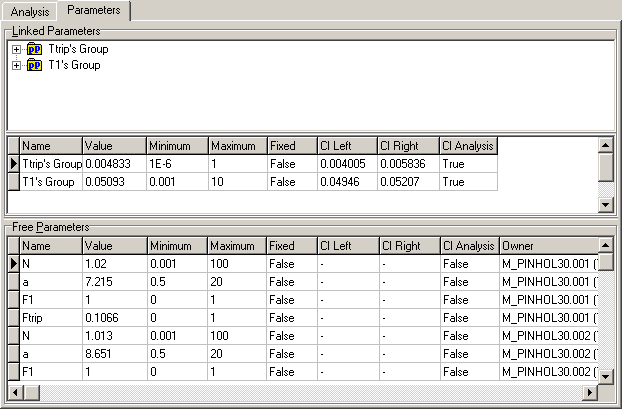
The following components are related to the Parameters page:
Linked Parameters treeview
Free Parameters table
Linked Parameters table
Click the corresponding item to get more information about it.
Linked Parameters treeview
Linked Parameters treeview is used for displaying the parameters linkage.
An example view of the Linked Parameters treeview is given below:
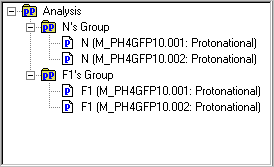
Parameters groups are marked by the following icon: 
Parameters are marked by the following icon: 
The names of the parameters groups and parameters are displayed on the right of the corresponding icons.
If the current parameters group is not empty then it is supplied with a special indicator  or
or  . Press this indicator to show or hide the parameters containing in the current parameters group.
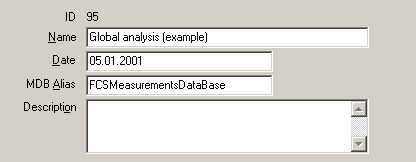
Analysis table
Local menu
This table displays the information about the performed and stored analysis.
It can be viewed as form view or datasheet view.
An example view of the Analysis table is given bellow:
Analysis
table contains the following fields:
|
Field
Name
|
Description
|
|
AnalysisID
|
Contains the unique identifier of the analysis. It displays as
ID.
|
|
Name
|
Contains the name of the analysis.
|
|
AnalysisDate
|
Contains the date when the analysis was performed and stored
into the database.
|
|
MDBAlias
|
Contains the
alias
of the Measurements
database About Measurements Database
from
which the experimental data were chosen
|
|
Description
|
Contains the short description of the analysis.
|
All actions under Analysis table are collected in local menu.
Notes
- Field AnalysisID is read only.
- This table can be sorted by any field (except Description). To perform the sorting by the given field, select this field and press Ascending/Descending Sort button in the Toolbar or choose Ascending/Descending menu items in the local menu.
- Use Quick Search button in the Toolbar or choose Quick Search menu items in local menu for quick searching the information in the selected field.
Local menu of the Analysis table
|
Items |
Description |
|
Delete |
Deletes the selected record. |
|
Edit |
Switches state of the table in edit mode. |
|
Post |
Saves current record in the Database. |
|
Cancel |
Cancels changes. |
|
Preview |
Opens
Preview
Window for
two-dimensional preview of the experimental and recovered
characteristics and residuals. |
|
Generate
Report |
Generates the report based on the selected
record. |
|
Export
Data |
Opens
Export
data dialog box that
allows exporting experimental and recovered characteristics and
residuals to the text file. |
|
Send
to FFSDP |
Sends current analysis to the FFS Data
Processor. |
|
Sort |
Sorts the table. |
|
Find
Record |
Allows
to set the filter on the table and to search the information by
typing the first few characters. |
|
View |
Allows to change the view
of the table. |
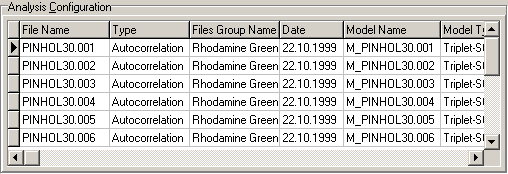
Analysis Configuration table
Local menu
This table displays configuration of the analysis.
An example view of the Analysis Configuration table is given bellow:
Analysis
Configuration table contains the following fields:
|
Field
Name
|
Description
|
|
FileID
|
Contains the ID of the record in Files table in the Measurements
Database.
|
|
File
Name
|
Contains the name of the characteristic (file) .
|
|
Type
|
Contains the type of experimental data
|
|
Model
Name
|
Contains the name of the model.
|
|
Model
Type
|
Contains the type of the model.
|
|
Start
Analysis At
|
Contains the initial channel for the
analysis.
|
|
End
Analysis At
|
Contains the end channel for the analysis.
|
|
Start
Criterion At
|
Contains the initial channel for the Chi
Square calculation.
|
|
NChannels
|
Contains the total number of channels.
|
|
DataSet
Type
|
Contains the type of the characteristic: Experimental or
Simulated.
|
|
Fit
Criterion
|
Contains the local fit criterion (Chi Square)
value.
|
|
Analysed
|
Is true if the DataSet is analysed.
|
|
Files
Group Name
|
Contains the Files Group name.
|
|
Observ
Date
|
Contains the date of measurement.
|
|
Sample
Pos
|
Contains the information about Sample position.
|
|
KineticN
|
Contains the kinetic number of the measurements.
|
|
RepeatN
|
Contains the repeat number of the measurements.
|
All actions under Analysis Configuration table are collected in local menu.
Notes
- There are two kinds of DataSets: Experimental and Simulated. For the first one the fields FileID, File Name, Type, Files Group Name, Observ Date, SamplePos, KineticN and RepeatN are the correspondent fields from the Measurements Database. To find out more about it see About Measurements Database help topic. For the second one File Name represents the name of Simulated DataSet, Date is the date of simulation of this DataSet and Files Group Name is blank field. Simulated DataSet has also properties, which can be displayed by Data Set Properties local menu item{linkID=5360} for this aim. This menu item runs Measurements Database if the DataSet is Experimental.
- The significant information (not all) from the Measurements Database are stored in the Analysis Database. The link to the Measurements Database is stored as well. It makes both Databases independent from each other. If this link is broken due to any reason (it may be export data to the another database), use the Locate DataSet form to locate the needed DataSet in the another Measurements Database, registered on the machine.
- All fields are read only.
- This table can be sorted by any field. To perform the sorting by the given field, select this field and press Ascending/Descending Sort button in the Toolbar or choose Ascending/Descending menu items in the local menu.
- Use Quick Search button in the Toolbar or choose Quick Search menu items in local menu for quick searching the information in the selected field.
Local menu of the Analysis Configuration Table
|
Items |
Description |
|
Locate
DataSet |
Opens
Data
Set Linker form
Is
used for linking the information stored in the Analysis Configuration
table with stored one in other Measurements Database, registered on
the machine. It is optional, because the significant information (not
all) from Measurements Database are already stored in the Analysis
Configuration table. It helps to restore the link to the Measurements
Database only. |
|
It
is enabled only for experimental DataSets. |
|
Data
Set Properties |
Opens Measurements Database
if
the Data Set is experimental one, which stored in Measurements
Database, or opens
Simulated
Data Set Properties form
if
the Data Set is simulated one. |
|
Sort |
Sorts the table. |
|
Find
Record |
Allows
to set the filter on the table and to search the information by
typing the first few characters. |
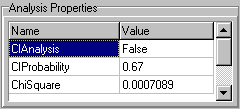
Analysis Properties table
Local menu
This table displays the properties of the current Analysis.
An example view of the Analysis Properties table is given bellow:
Analysis
Properties table contains the following fields:
|
Field
Name
|
Description
|
|
Name
|
Contains the name of the property.
|
|
Value
|
Contains the value of the property.
|
All actions under Analysis Properties table are collected in local menu.
Notes
- All fields are read only.
- This table can be sorted by any field. To perform the sorting by the given field, select this field and press Ascending/Descending Sort button in the Toolbar or choose Ascending/Descending menu items in the local menu.
- Use Quick Search button in the Toolbar or choose Quick Search menu items in local menu for quick searching the information in the selected field.
Local menu of the Analysis Properties Table
|
Items |
Description |
|
Sort |
Sorts the table. |
|
Find
Record |
Allows
to set the filter on the table and to search the information by
typing the first few characters. |
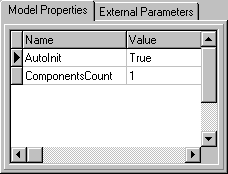
Model Properties table
Local menu
This table displays the properties of the selected model in Analysis Configuration table.
An example view of the Model Properties table is given bellow:
Model
Properties table contains the following fields:
|
Field
Name
|
Description
|
|
Name
|
Contains the name of the
property.
|
|
Value
|
Contains the value of the property.
|
All actions under Model Properties table are collected in local menu.
Notes
- All fields are read only.
- This table can be sorted by any field. To perform the sorting by the given field, select this field and press Ascending/Descending Sort button in the Toolbar or choose Ascending/Descending menu items in the local menu.
- Use Quick Search button in the Toolbar or choose Quick Search menu items in local menu for quick searching the information in the selected field.
Local menu of the Model Properties Table
|
Items |
Description |
|
Configuration |
Shows custom model script. (It is enabled only for
Configuration property of custom model) |
|
Sort |
Sorts the table. |
|
Find
Record |
Allows
to set the filter on the table and to search the information by
typing the first few characters. |
External Parameters table
Local menu
This table displays external parameters of the selected characteristic (file) in Analysis Configuration table.
An example view of the External Parameters table is given bellow:
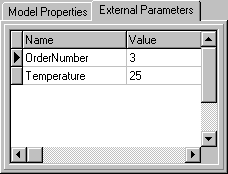
External
Parameters table contains the following fields:
|
Field
Name
|
Description
|
|
Name
|
Contains the name of the
parameter.
|
|
Value
|
Contains the value of the
parameter.
|
All actions under External Parameters table are collected in local menu.
Notes
- All fields are read only.
- This table can be sorted by any field. To perform the sorting by the given field, select this field and press Ascending/Descending Sort button in the Toolbar or choose Ascending/Descending menu items in the local menu.
- Use Quick Search button in the Toolbar or choose Quick Search menu items in local menu for quick searching the information in the selected field.
Local menu of the External Parameters Table
|
Items
|
Description
|
|
Refresh
|
Refreshes data in the table.
|
|
Sort
|
Sorts the table.
|
|
Find
Record
|
Allows to set the
filter on the table and to search the information by typing the first
few characters.
|
Linked Parameters table
Local menu
This table displays the settings of the parameters groups in the current analysis.
An example view of the Linked Parameters table is given bellow:
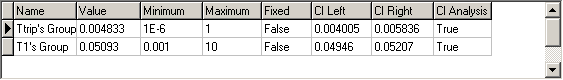
Linked
Parameters table contains the following fields:
|
Field
Name
|
Description
|
|
Name
|
Contains the name of the parameters group.
|
|
Value
|
Contains the value of the parameter or parameters group. This
value should belong to the interval from the minimum value contained
in the field Minimum to the maximum value contained in
the field Maximum.
|
|
Minimum
|
Contains the minimum constraint for the value of parameter or
parameters group.
|
|
Maximum
|
Contains the maximum constraint for the value of parameter or
parameters group
|
|
Fixed
|
Indicates whether the current parameter
or parameters group
should be fitted during the analysis. If Fixed is true
then the value of the current parameter
will be constant
during the analysis, otherwise the parameter will be fitted.
|
|
CI
Left, CI
Right
|
Contain left and right bound of the confidence
interval, which was obtained for the current parameters group if the
confidence interval analysis has been performed for it.
|
|
CI
Analysis
|
Indicates whether the confidence interval analysis
has been performed for the current parameters group.
|
All actions under Linked Parameters table are collected in local menu.
Notes
- All fields are read only.
- This table can be sorted by any field. To perform the sorting by the given field, select this field and press Ascending/Descending Sort button in the Toolbar or choose Ascending/Descending menu items in the local menu.
- Use Quick Search button in the Toolbar or choose Quick Search menu items in local menu for quick searching the information in the selected field.
Local menu of the Linked Parameters Table
|
Items |
Description |
|
Sort |
Sorts the table. |
|
Find
Record |
Allows
to set the filter on the table and search the information by typing
the first few characters. |
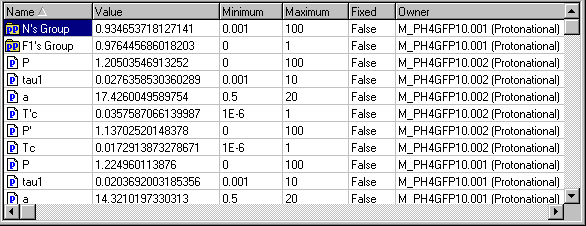
Free Parameters table
Local menu
This table displays the settings of the parameters related to the current analysis.
An example view of the Free Parameters table is given bellow:
Free
Parameters table contains the following fields:
|
Field
Name
|
Description
|
|
Name
|
Contains the name of the parameter.
|
|
Value
|
Contains the value of the parameter or parameters group. This
value should belong to the interval from the minimum value contained
in the field Minimum to the maximum value contained in
the field Maximum.
|
|
Minimum
|
Contains the minimum constraint for the value of parameter or
parameters group.
|
|
Maximum
|
Contains the maximum constraint for the value of parameter or
parameters group
|
|
Fixed
|
Indicates whether the current parameter
or parameters group
should be fitted during the analysis. If Fixed is true
then the value of the current parameter
will be constant
during the analysis, otherwise the parameter will be fitted.
|
|
CI
Left, CI
Right
|
Contain left and right bound of the confidence
interval, which was obtained for the current parameters group if the
confidence interval analysis has been performed for it.
|
|
CI
Analysis
|
Indicates whether the confidence interval analysis
has been performed for the current parameters group.
|
|
Owner
|
Contains the name and type of the model, to which the current
parameter belongs.
|
All actions under Free Parameters table are collected in local menu.
Notes
- All fields are read only.
- This table can be sorted by any field. To perform the sorting by the given field, select this field and press Ascending/Descending Sort button in the Toolbar or choose Ascending/Descending menu items in the
local menu.
- Use Quick Search button in the Toolbar or choose Quick Search menu items in local menu for quick searching the information in the selected field.
Local menu of the Free Parameters Table
Simulated DataSet Properties form
This form displays properties and parameters of the models used for the simulation of the DataSet.
An example view of the Simulated DataSet Properties form is given in the following figure:
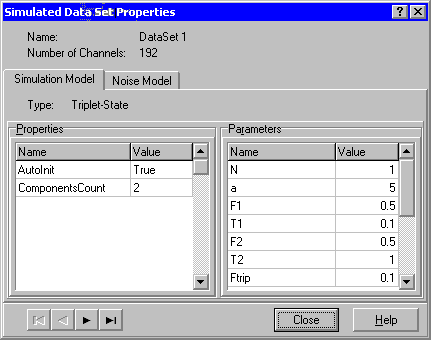
To find out more about the functionality of any component, click this component in the figure.
Simulation model page
Shows properties and parameters of the simulation model.
An example view of the Simulation model page is given in the following figure:

Noise model page
Shows properties of the noise model.
An example view of the Noise model page is given in the following figure:

Button "Close"
This button closes Simulated Data Set Properties form.
Button "Help"
This button opens the help window that describes how to work with Simulated Data Set Properties form.
Navigator

This Navigator allows to look through the Data Sets of the current analysis.
Templates form
This form is used for working with the Templates table. It displays configuration, settings and linkage of parameters of the selected template.
An example view of the Templates form is given in the following figure:
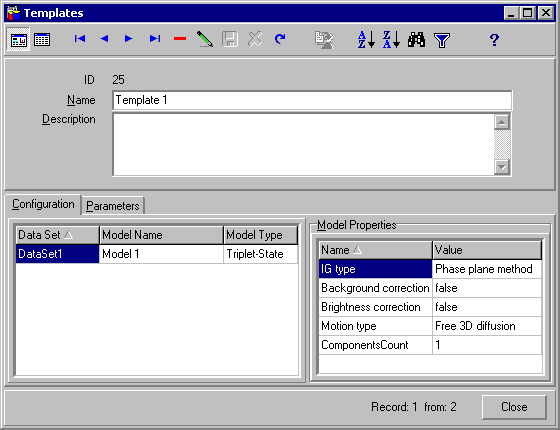
To find out more about the functionality of any component, click this component in the figure.
All actions under Templates table are collected in the local menu.
Main panel
Represents information fields from Templates table. It can be viewed as a form view or datasheet view.
Configuration page
Displays configuration of the template and properties of each model.
An example view of the Configuration page is given in the following figure:
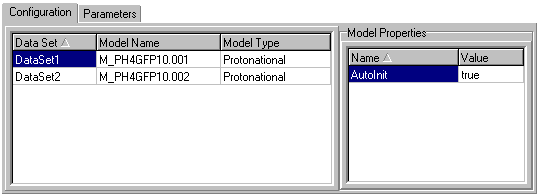
To find out more about the functionality of any component, click this component in the figure.
Templates table
Local menu
This table represents all fields from Templates table.
It can be viewed as a form view or datasheet view.
An example view of the Templates table is given bellow:
Templates table contains the following fields:
|
Field
Name
|
Description
|
|
TemplateID
|
Contains the unique identifier (ID) of the
template.
|
|
Name
|
Contains the name of the template.
|
|
Template
|
Contains the body of the template.
|
|
Description
|
Contains the short description of the template.
|
All actions under Templates table are collected in local menu.
Notes
- Field TemplateID is read only.
- This table can be sorted by any field (except Template and Description). To perform the sorting by the given field, select this field then press Ascending/Descending Sort button in the Toolbar or choose Ascending/Descending menu items in local menu.
- Use Quick Search button in the Toolbar or choose Quick Search menu items in local menu for quick searching the information in the selected field.
Local menu of the Templates table
|
Items |
Description |
|
Delete |
Deletes selected record. |
|
Edit |
Switches state of the table in edit mode. |
|
Post |
Saves current record in the Database. |
|
Cancel |
Cancels changes. |
|
Sort |
Sorts the table. |
|
Find
Record |
Allows
to set the filter on the table and to search the information by
typing the first few characters. |
|
Send
to FFSDP |
Applies the selected template in the FFS Data
Processor. |
|
View |
Allows to change the view
of the table. |
Configuration table
This table displays configuration of the template.
An example view of the Configuration table is given bellow:
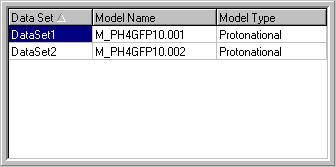
Configuration
table contains the following fields:
|
Field
Name
|
Description
|
|
Data
Set
|
Contains the name of the Data Set, mostly with autoincrement number.
|
|
Model
Name
|
Contains the name of the model.
|
|
Model
Type
|
Contains the type of the model.
|
Notes
The parameters, that are displayed in this table, can be sorted by any field. To perform the sorting by the given field, click the header of the correspondent column. To change the sorting order, click the same header second time. A small triangle to the right of the header name shows the sort order.
Model Properties table
Local menu
This table displays properties of the selected model in Model Properties table.
An example view of the Model Properties table is given bellow:
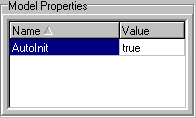
Model
Properties table contains the following fields:
|
Field
Name
|
Description
|
|
Name
|
Contains the name of the property.
|
|
Value
|
Contains the value of the property.
|
Notes
The properties, that are displayed in this table, can be sorted by any field. To perform the sorting by the given field, click the header of the correspondent column. To change the sorting order, click the same header second time. A small triangle to the right of the header name shows the sort order.
Parameters page
Displays the linkage and settings of parameters.
An example view of the Parameters page is given in the following figure:
To find out more about the functionality of any component, click this component in the figure.
Linked parameters treeview
Linked parameters treeview is used for displaying the parameters linkage.
An example view of the Linked parameters treeview is given below:
Parameters groups are marked by the following icon:
Parameters are marked by the following icon:
The names of the parameters groups and parameters are displayed on the right side of the corresponding icons.
If the current parameters group is not empty then it is supplied with a special indicator or . Press this indicator to show or hide the parameters containing in the current parameters group.
Parameters table
This table displays the settings of the parameters and parameters groups related to the current analysis.
An example view of the Parameters table is given in the following figure:
Parameters
table contains the following fields:
|
Field
Name
|
Description
|
|
Name
|
Contains the name of the parameter or parameters group.
|
|
Value
|
Contains the value of the parameter or parameters group. This
value should belong to the interval from the minimum value contained
in the field Minimum to the maximum value contained in the field
Maximum.
|
|
Minimum
|
Contains the minimum constraint for the value of parameter or
parameters group.
|
|
Maximum
|
Contains the maximum constraint for the value of parameter or
parameters group.
|
|
Fixed
|
Indicates whether the current parameter
or parameters group
should be fitted during the analysis. If Fixed is true
then the value of the current parameter
will be constant
during the analysis, otherwise the parameter will be fitted.
|
|
Owner
|
Contains the name and type of the model, to which the current
parameter belongs
(for
parameters only).
|
Notes
The parameters that are displayed in this table can be sorted by any field. To perform the sorting by the given field, click the header of the correspondent column. To change the sorting order, click the same header second time. A small triangle to the right of the header name shows the sort direction.
Button Close
This button closes the Templates form.
Preview window
This window is used for two-dimensional display of the experimental and recovered characteristics and residuals stored in the current record of the Analysis Configuration table. The name of the analysis and the name of the characteristic are displayed in the title of this window. The window consists of two charts: Characteristics and Residuals. The dimensions displayed along the vertical and horizontal axes depend from the type of the characteristic.
An example view of the Preview window is given below:
Use local menu of 2D Chart for customizing the chart, export chart data to text and BMP files, save, apply and reset user defined settings.
Use Navigator in the bottom of this window to look through other characteristics participating in the current analysis.
Close button closes this window.
Help button opens the help window that describes how to work with Preview window.
Residuals chart
This 2D Chart is used for two-dimensional display of the residuals stored in the current record of "Analysis Configuration" table. The dimensions displayed along the vertical and horizontal axes depend from the type of the characteristic and including weight factors in the analysis (weighted fit).
Characteristics chart
This 2D Chart is used for two-dimensional display of the experimental and recovered characteristics stored in the current record of the "Analysis Configuration" table. The dimensions displayed along the vertical and horizontal axes depend from the type of the characteristic.
Button "Close"
This button closes this form.
Navigator
This Navigator allows to look through experimental and recovered characteristics and residuals.
Button "Help"
Opens the help window that describes how to work with Preview window.
Report Options dialog box
This dialog box is used for customizing the Report and selecting records which will be included into the Report. You can specify Page Setup settings to adjust the printed area.
An example view of the dialog box is given below:
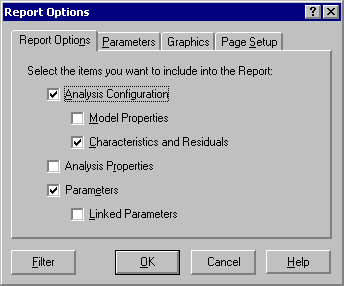
To find out more about the functionality of any component, click this component in the figure.
"Analysis Configuration" check box
Check this box if you want to include into the Report the configuration of the analysis.
"Model Properties" check box
Check this box if you want to include into the Report the properties of the models.
Model Properties check box is enabled if Analysis Configuration check box is checked.
Button "Ok"
This button closes the dialog box and starts creation of the report.
Button "Help"
This button opens the help window that describes how to work with Report Options dialog box.
Button "Cancel"
This button closes the dialog box without creation of the report.
"Characteristics and residuals" check box<