|
|
|
| |

|
Products
|
| |
|
Main page
/
Software
/ Products
|
|
|
BIFL Data Analyser 1.5

|
BIFL Data Analyzer (BIFLDA) is intended for sliding analysis of time resolved fluorescence and anisotropy decays and autocorrelation curves built from BIFL (Bursts Integrated Fluorescence Lifetime) data. Inter arrival time distribution (IATD) coincidence analysis is also supported (new). Automatic and manual selection of bursts is possible. The analysis is performed using Maximum Likelihood method with multinomial statistics and Marquardt-Levenberg optimization. While performing parameters estimation, the software takes into account several possible instrumental distortions that can present in measured data (time shift, background, G-factor). After analysis the fluorescence and triplet lifetime distributions are plotted. BIFLDA software processes data obtained either from polarized measurements with two detectors collecting parallel and perpendicular traces or from two detectors collecting two different colors (four channels setup is supported). B&H SPC-402/432, SPC-401/431, SPC-6x0/256ch,
SPC-6x0/4096ch, SPC-830 and other complementary to SPC-830 data formats (SPC-130/134, SPC-140/144, SPC-150/154), PicoQuant PicoHarp 300, Time Harp 200, Symphotime-64bit (new) dataformats are supported. Other dataformats can be implemented upon request.
|
|
|
|
|
|
|
FCS Data Processor 1.4 (build 2)
|
The FCS Data Processor (FCSDP) was extended by including PCH and FCA and renamed into FFS Data Processor.
|
|
|
|
|
|
|
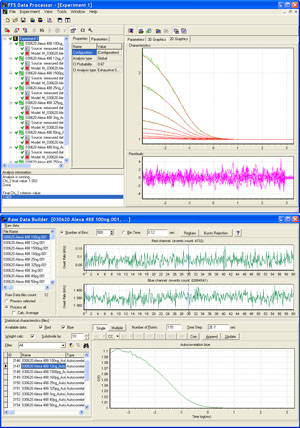
FFS Data Processor 2.7
|
The FFS Data Processor (FFSDP) software is developed to analyze data obtained from the Fluorescence Fluctuation Spectroscopy measurements. FCS, FCCS, TIR-FCS, PCH/FIDA, PCMH/FIMDA, FCA, TIFCA and Coincidence analysis are supported. The FFSDP can import both binary raw data traces and directly calculated (by e.g. hardware correlator, etc.) statistical characteristics of the photon flow such as auto(cross)correlation functions, photon counting distributions and fluorescence factorial cumulants. ConfoCor, ConfoCor2, ConfoCor3 (Carl Zeiss GmbH), ISS ALBA, PicoHarp 300, Time Harp 200, Symphotime 64 (PicoQuant GmbH) and B&H SPC data formats (SPC-402/432, SPC-401/431, SPC-6x0/256ch, SPC-6x0/4096ch, SPC-830 and other complementary to SPC-830 data formats SPC-130/134, SPC-140/144, SPC-150/154 and SPC-132/142/152 are supported. Software calculates autocorrelation (ACF) and crosscorrelation (CCF) functions, photon counting distribution (PCD), inter-event time distribution (IED), fluorescence factorial cumulants (FFC) and coincidence histograms from imported binary raw data. A number of raw data files can be imported and processed in a batch mode. The software has a powerful tool on a board for processing of the raw data that allows to calculate the big number of ACFs, PCDs, ... in different regimes, in a sliding scheme, with increasing the time step, etc.
Global fit of ACF, CCF, PCD, FFC in any combination with common parameters linking is the main feature of FFS Data Processor. In addition, a number of characteristics can be analyzed sequentially one by one. Analysis of coincidence histograms with calculation of separation value and coincidence burst counting can be also performed. Rejection of unwanted bursts in intensity while calculation of ACF, PCD, etc. from the raw data is available. ACF, PCD, etc. curves can be calculated from raw data in shorter (than duration of measurements) time intervals in a sliding scheme or from automatically selected bursts (new). Software package contains a set of most popular models for correlation functions fitting: pure-diffusion model, triplet-state model, conformational model, protonation model and flow model. 2D and 3D free, anomalous and confined diffusion types are supported. Corrections for out-of-focus emission, dead time, afterpulses, diffusion and triplet processes is available in PCH/FIDA and (TI)FCA analyses. A set of most popular brightness profile approximations including Gauss-Lorenzian and FIDA-like polinomial is supported in both PCH/FIDA and (TI)FCA. Software provides quick and easy creation and saving of user-defined models programmed by means of the build-in script language. Besides standard graphs displaying the analysis results, software can show and fit to a model a graphical dependence of fit parameters on any variable characterizing the source data, like temperature, wavelength, etc.
The software is described in the book chapter (you can use it in your citations): Skakun, V.V. Global Analysis of Autocorrelation Functions and Photon Counting Distributions in Fluorescence Fluctuation Spectroscopy / V.V. Skakun, A.V. Digris, and V.V. Apanasovich // In book Fluorescence Spectroscopy and Microscopy: Methods and Protocols: Methods in Molecular Biology, Springer Protocols. Springer Science+Business Media, LLC. vol. 1076. 2014. P. 719-741. DOI 10.1007/978-1-62703-649-8_33
|
|
|
|
|
|
|
TRFA Data Processor 1.4 (build 1)

|
The TRFA Data Processor (TRFADP) software is developed to analyze the data collected from time-resolved fluorescence decay measurements. The TRFADP software provides fluorescence and anisotropy decay analysis of fluorescence decays, taken either from measurements with one-exponential reference compound or from measurements with a scatter. Anisotropy analysis is implemented as simultaneous analysis of parallel and perpendicular fluorescence decays. Associative and non-associative anisotropy analysis is supported. While performing parameters estimation, the software takes into account several possible instrumental distortions that may present in measured data (time shift, background, anisotropy G-factor). The core of software package contains two widely used models: a sum of exponentials and a dipole-dipole energy transfer model. After analysis is done, the values of estimated parameters, final value of chi-square criterion and tree- and two-dimensional graphical dependencies of weighted residuals and autocorrelation functions of weighted residuals are available for judging the quality of the fit.
|
|
|
|
|
|
|
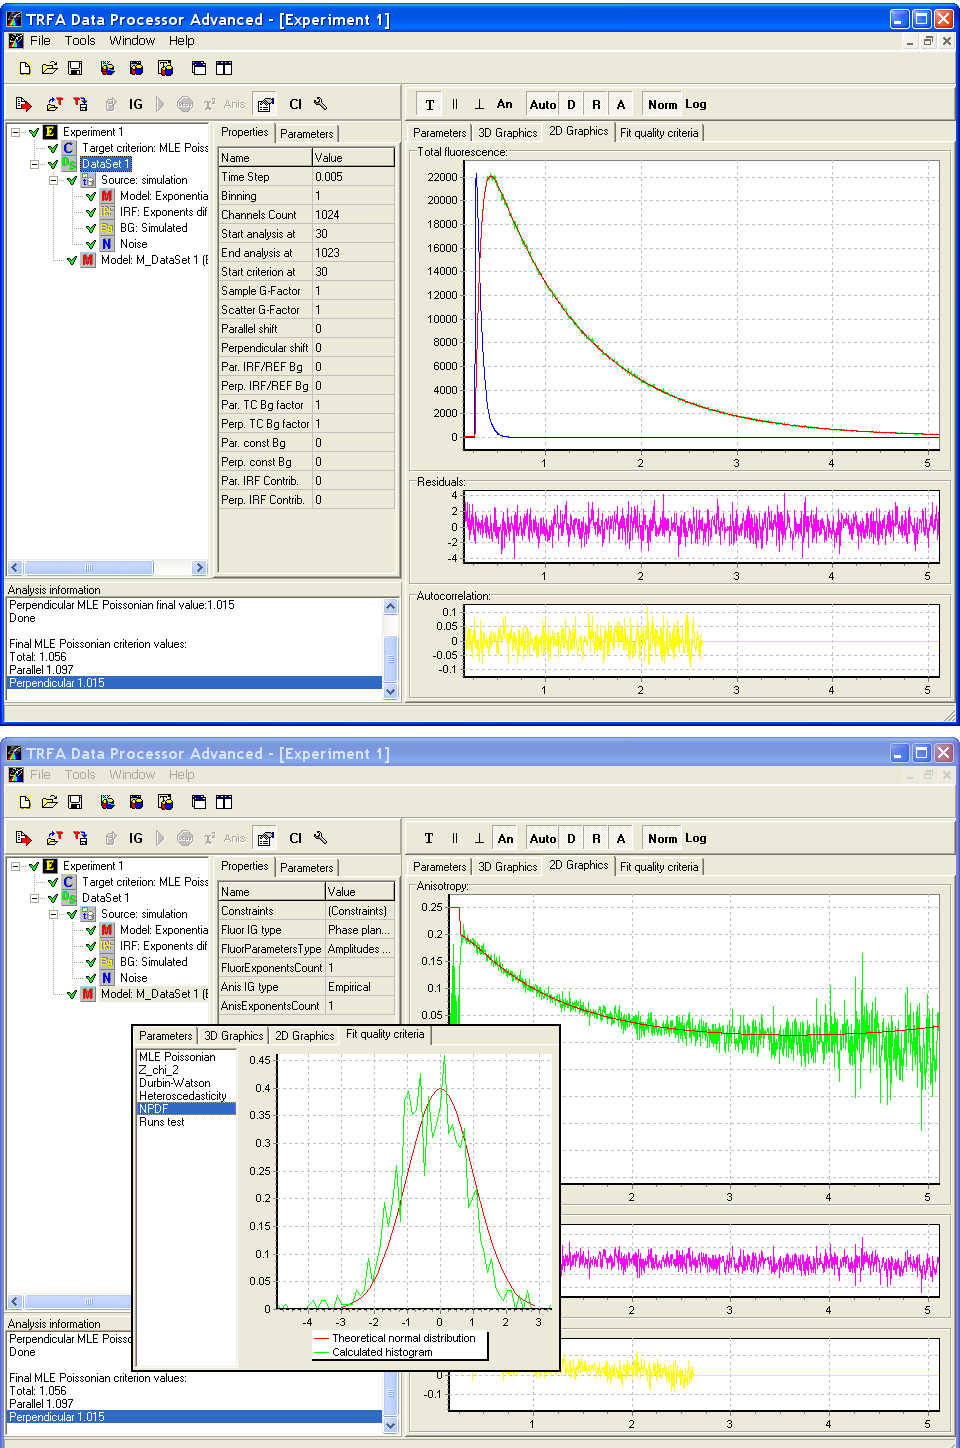
TRFA Data Processor Advanced 1.4

|
The TRFA Data Processor Advanced (TRFADPAdv) software is developed to analyze the data collected from time-resolved fluorescence decay measurements. It provides a global analysis of fluorescence and anisotropy decays, taken either from measurements with one-exponential reference compound or from measurements with a scatter. Anisotropy analysis can be done in two ways. The first one is a two step analysis. In this case on the first step total decay is constructed from parallel and perpendicular decay components and analyzed in order to get the fluorescence decay parameters. On the second step obtained values of the fluorescence decay parameters are fixed and parallel and perpendicular decays are analyzed simultaneously in order to estimate the anisotropy parameters. The second way to analyze anisotropy is a one step global analysis of several fluorescence decays measured at different polarization angles. In this case the associative and non-associative anisotropy analysis can be performed. While performing parameters estimation, the software takes into account several possible instrumental distortions that may present in measured data (time shift, background, anisotropy G-factor). The most distortion parameters as well as reference decay time are fit parameters. The core of software package contains a number of widely used models: a sum of exponentials, 2- and 3- compartmental models for analysis of excited-state reactions, etc. The analysis procedure consists of fast non-iterative analysis algorithms (based on the phase plane method) that are used for generating initial guesses and iterative fit routine. The iterative analysis is based on Least-Squares and MLE (with poissonian statistics of the noise) methods with Marquardt-Levenberg optimization algorithm. The software supports setting the user defined constraints for all fit parameters by defining the minim and maximum values as wel as by organizing more complex functional parameter relationships. The quality of the fit can be judged by inspecting the final value of target fit criterion, graphs of weighted residuals and autocorrelation of weighted residuals, ZChi2 criterion, Durbin Watson and Runs tests, Heterosedasticity and Normal probability function of the residuals. The confidential intervals for estimated parameters can be calculated either by standard errors or by exhaustive search method. The implemented Phasor analysis allows the complete analysis of bi-exponential data with estimation of pre-exponential factors and calculation of criterion. The interface of the Advanced version of TRFADP is optimized for managing relatively large number of data sets and fit parameters. Software can import data from ASCII text files of various data-formats (including multi-column data) and from B&H SPC and PicoQuant PHD and binary Raw Data files.
The software is described in the book chapter (you can use it in your citations): Digris, A.V.,E.G. Novikov, V.V. Skakun, and V.V. Apanasovich. Global Analysis of Time-Resolved Fluorescence Data // In book Fluorescence Spectroscopy and Microscopy: Methods and Protocols: Methods in Molecular Biology, Springer Protocols. Springer Science+Business Media, LLC. vol. 1076. 2014. P. 257-277. DOI 10.1007/978-1-62703-649-8_10
|
|
|
|
|
|
|
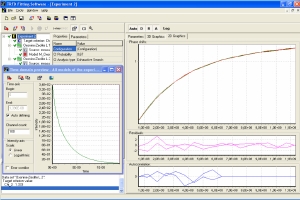
TRFD Fitting Software 2.0 (build 2)
|
The TRFD Fitting Software (TRFDFS) provides the data analysis of data obtained from frequency domain experiments. More than one frequency dependence of phase shift can simultaneously be fitted. A list of fitting models is included into the package: a multiexponentials, the dipole-dipole energy transfer model, and a diffusion-controlled collisional energy transfer model. User-defined models are supported. Besides setting minimum and maximum values for each fit parameter the TRFDFS provides creation of complex parameter constraints presented in the equation form. Runs test, normal deviation of chi-square, and heteroscedasticity of weighted residuals are available for judging the quality of the fit. Two-dimensional data plot of the fluorescence decay in time domain allows viewing the theoretical decay curve that corresponds to the phase shift dependence obtained after the fit. A plot of fit parameters versus any external parameters can be monitored for studying the dependence of the fit parameters on external experiment parameters or conditions. The TRFDFS owns the possibility to save and restore main interface settings, including position, size and colors of the windows.
|
|
|
|
|
|
| |
|
|